


HAAM Index / Systems / Design Intelligence
July 4, 2026 · 15 min read · By Kris Haamer
Business Intelligence Is Design After Launch
How digital assets become measurable signals, how automation turns those signals into intelligence, and how funnels connect designed experiences to business outcomes.
Process: signals and models
Output: decisions
Loop: design again
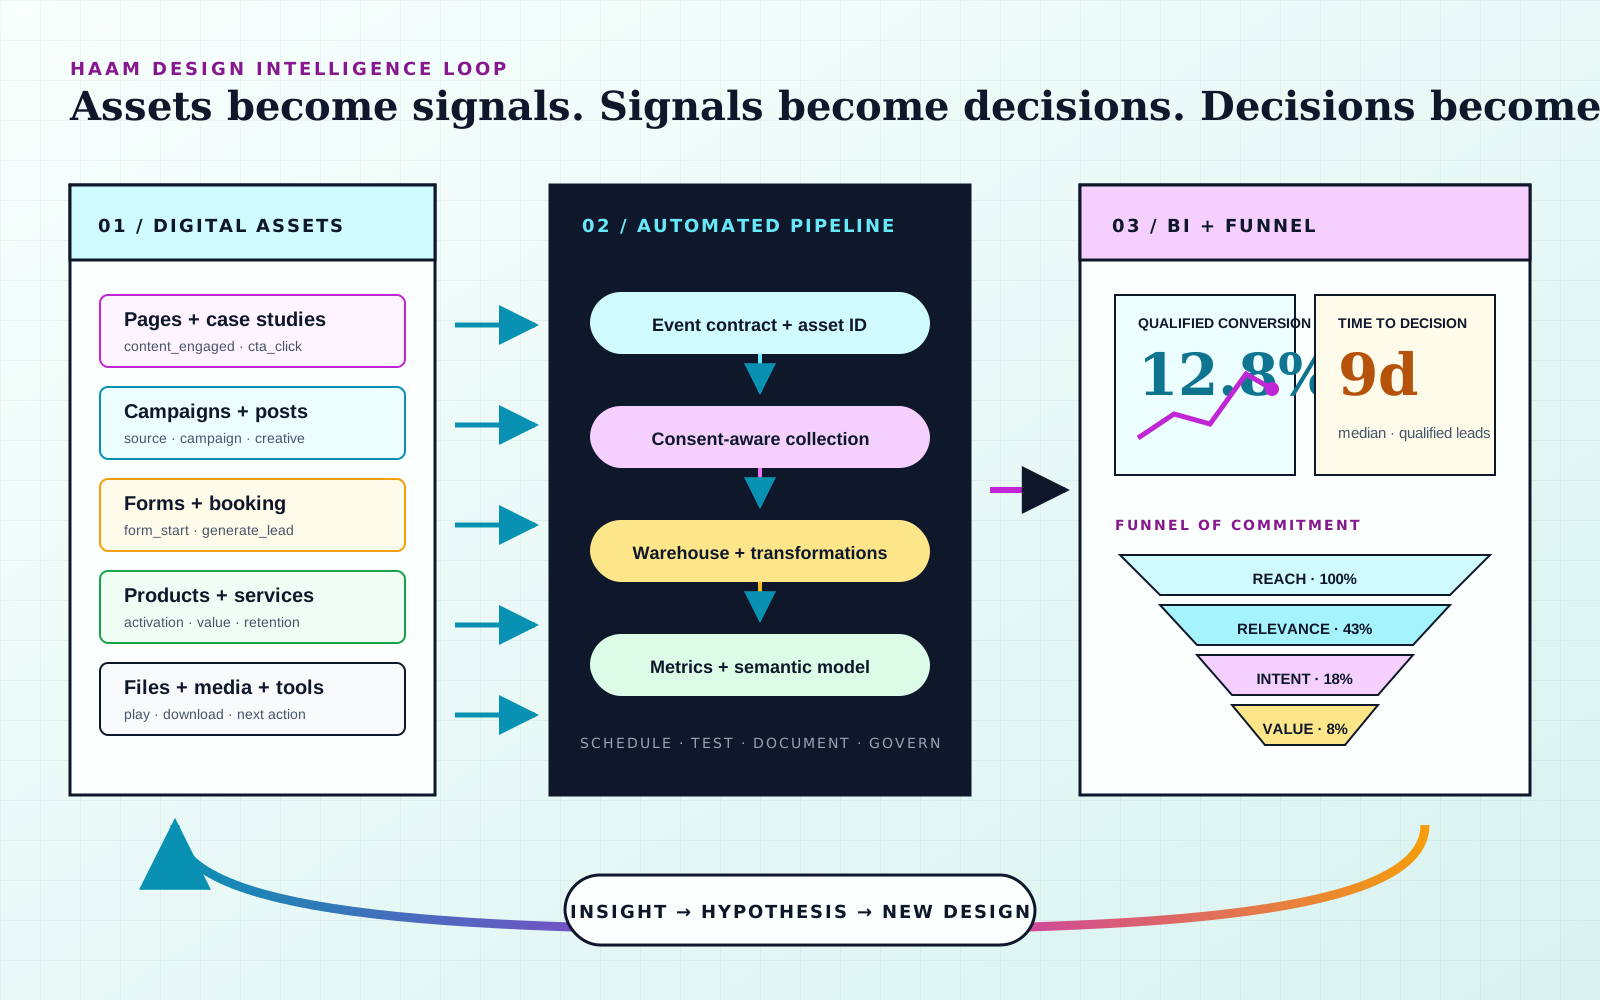
Working thesis
Design gives a business something to observe. Business intelligence turns observation into a decision. A funnel makes the relationship visible by tracing how attention becomes trust, action, value, and return.
01
One loop, two moments
Design and business intelligence are not separate disciplines.
Design decides what people can see, understand, trust, and do. Business intelligence observes what happened after those decisions entered the world. One shapes conditions. The other reads consequences.
The usual organisational split makes this relationship hard to see. Designers are asked to improve an interface. Analysts are asked to explain a number. Marketing owns acquisition. Sales owns the lead. Operations owns delivery. Each team receives a fragment, while the customer experiences one continuous system.
The useful unit is not the screen or the dashboard. It is the decision loop: a hypothesis becomes an asset, the asset produces behavior, behavior becomes data, data becomes interpretation, and interpretation changes the next design.
A dashboard that cannot change a decision is decoration.
02
Assets as instruments
Every digital asset can become part of the sensing layer.
A digital asset is usually treated as an output: a page was published, a campaign launched, a PDF uploaded, a form shipped. In a BI system, the same object is also an instrument that can produce structured evidence.
This does not mean tracking everything. It means deciding which behavior would help evaluate the asset's purpose. A case study should not be judged only by traffic. It may need to reveal whether the right audience understood a capability, inspected evidence, moved to a relevant service, and eventually became a viable project.
Pages and case studies
Signals: Views, engaged reading, scroll depth, internal paths, CTA selection
Which ideas create enough relevance and trust for someone to continue?
Campaigns and social posts
Signals: Source, campaign, creative, landing-page behavior, assisted conversion
Which promise attracts the right attention rather than the largest audience?
Forms and booking flows
Signals: Start, field friction, abandonment, submission, qualification, response time
Where does intent become work, and where does the interface lose it?
Products and service tools
Signals: Activation, feature use, task completion, retention, support demand
Does the designed system create value after the first click?
Documents, videos, and downloads
Signals: Open, play, completion, download, return visit, follow-up action
Which assets help people evaluate, learn, or decide?
Design-system components
Signals: Component exposure, interaction, errors, variants, downstream conversion
Which reusable patterns make the whole product perform better or worse?
03
Instrumentation
Measurement is part of the design specification.
The best time to decide what an interaction means is before it produces millions of ambiguous records. Event names, properties, consent rules, asset IDs, and ownership belong beside states, content, accessibility, and error handling.
A data layer creates a stable boundary between the experience and the tools observing it. Instead of scraping meaning from button text or page structure, the interface deliberately emits an event such as select_content, form_start, or generate_lead with controlled properties.
The event contract should answer five questions: what happened, where it happened, which asset or offer was involved, what stage of intent it represents, and what must never be collected. Personal names, email addresses, phone numbers, free-form messages, and sensitive content do not belong in behavioral analytics.
| Field | Example | Design purpose |
|---|---|---|
| event_name | cta_click | Names the meaningful action. |
| asset_id | service_interaction_design | Connects behavior to a stable digital object. |
| funnel_stage | intent | Places the action in a journey model. |
| cta_variant | start_project_primary | Makes design variants comparable. |
| audience | founder | Tests whether the experience serves the intended group. |
| experiment_id | pricing_frame_02 | Connects a change to its hypothesis. |
| privacy_class | anonymous_behavior | Makes collection limits explicit. |
04
Automation
The pipeline turns scattered signals into organisational memory.
Digital assets generate fragments across analytics tools, search platforms, ad systems, email software, CRMs, payment systems, support channels, and product databases. Automation makes those fragments meet.
The point is not to buy a maximal stack. The point is to remove manual copying, preserve definitions, and create a repeatable path from an event to a decision. A small studio can begin with scheduled exports and a shared model. A larger product can use streaming collection, a warehouse, tested transformations, a semantic layer, and automated activation.
Register the asset
Give every page, campaign, form, tool, email, and downloadable object a stable ID, owner, audience, purpose, lifecycle state, and intended action.
Define the event contract
Specify the events and properties the asset may produce. Names, meanings, privacy limits, required fields, and ownership should be designed before launch.
Collect with consent
Use a data layer, product analytics, server events, CRM updates, and platform APIs to capture behavior without placing personal or free-form content into analytics.
Move data automatically
Scheduled exports and connectors move analytics, search, campaign, CRM, sales, and product data into a warehouse or shared reporting layer.
Transform into meaning
Raw events become reliable dimensions and facts: assets, audiences, sessions, leads, opportunities, projects, revenue, retention, and experiments.
Model decisions
A semantic layer defines shared metrics so design, marketing, sales, and leadership do not calculate the same concept in incompatible ways.
Activate the insight
Dashboards, alerts, briefs, and experiment backlogs turn patterns into assigned decisions. Intelligence is complete only when something changes.
A practical model often separates dimensions from facts. A dim_assets table describes pages, campaigns, tools, and content. A fact_events table records behavior. A fact_leads table connects qualified intent to the CRM. A fact_projects table connects promises to delivered work and revenue.
Once these relationships exist, BI can answer questions that no single platform can answer: which article assisted a strong lead, which service page attracts poor-fit requests, which project story reduces sales time, which source produces retained clients, and which design change improved conversion without damaging quality.
05
Dashboard design
Business intelligence is also an interface problem.
A BI dashboard chooses hierarchy, comparison, defaults, thresholds, language, visual encoding, interaction, and access. Those are design decisions. They influence what an organisation notices and what it ignores.
The dangerous dashboard is not merely ugly. It is persuasive in the wrong direction. A total without a denominator can reward scale over quality. An average can hide a damaged segment. A conversion rate can improve because fewer low-intent people entered the funnel. A red alert can create urgency without context. A real-time chart can make noise feel more important than a slow structural change.
Context before score
Show target, baseline, period, segment, confidence, and the decision the metric is meant to support.
Sequence before totals
Expose the path between stages so teams can see where behavior changed, not only where it ended.
Action beside evidence
Place an owner, hypothesis, next review date, and decision log close to the visual, not in another system.
06
Funnels
A funnel is a designed sequence of commitments.
The funnel is often drawn as a cone because numbers become smaller. That image can hide the real design problem. People do not fall through a business. They make a sequence of judgments under changing levels of uncertainty.
Each stage asks for a different commitment. Reading costs attention. Opening a case study risks disappointment. Starting a form requires effort. Sharing contact information requires trust. Accepting a proposal commits money and reputation. Continuing the relationship depends on delivered value.
- 01
Reach
A person encounters a page, post, search result, event, recommendation, or campaign.
- 02
Relevance
They spend enough attention to understand that the offer may concern them.
- 03
Trust
They inspect evidence, work, people, process, pricing, safeguards, or social proof.
- 04
Intent
They choose a service, tool, project starter, contact route, or other meaningful next step.
- 05
Commitment
They begin and complete a form, booking, signup, purchase, or proposal process.
- 06
Value
The product or service delivers the outcome that justified the commitment.
- 07
Return
They come back, expand the relationship, renew, recommend, or contribute evidence for the next cycle.
Funnels should be built from user evidence, not from the company's departmental chart. A closed funnel is useful when every person must begin at the same first step. An open funnel is useful when people can enter through recommendations, search, a case study, a product, or a direct conversation. The model should match reality rather than forcing every journey into a campaign landing page.
07
Funnel construction
Measure the handoffs, not only the endpoints.
The most useful funnel questions sit between stages. What did people need before moving forward? How long did the transition take? Which source, audience, device, offer, or content path changed the probability? What happened after conversion?
Step conversion
The share moving from one defined stage to the next.
Time to next step
How long uncertainty persists between commitments.
Entry quality
Whether a source produces relevant people, not only volume.
Assisted influence
Which assets contributed before the final conversion.
Outcome quality
Whether the conversion became a useful relationship or delivered value.
Cost to progress
What money, labor, and attention were required to advance a person.
Cohort retention
Whether the value survives after acquisition.
Data confidence
Whether missing, duplicated, or biased data limits the conclusion.
A funnel should therefore connect acquisition data to experience data, experience data to CRM data, CRM data to delivery, and delivery to retention or referral. Otherwise the system optimizes the easiest measurable transition and loses sight of whether the business created value.
08
The operating system
BI should continuously create design work.
Intelligence becomes useful when it enters a rhythm. Signals are reviewed, questions are framed, changes are assigned, outcomes are checked, and the organisation records what it learned.
Daily
Watch broken collection, unusual drop-offs, failed forms, campaign anomalies, and high-intent signals that require a response.
Weekly
Review one funnel, choose one design question, assign one change, and record the expected effect before implementation.
Monthly
Compare cohorts, channels, assets, offers, and outcomes. Retire vanity metrics and update the measurement model.
Quarterly
Revisit the business model, audience, funnel boundaries, metric definitions, privacy rules, and the assets the system should create next.
The weekly design question is more valuable than a weekly dashboard tour. It may be: why do people read the service page but not inspect the work? Why do qualified visitors begin the form and stop at the budget field? Why does one case study produce conversations with a much shorter sales cycle? What evidence is missing for a returning visitor?
The answer should become a hypothesis and a designed intervention. That could be new content, a reordered page, a clearer offer, a different CTA, stronger proof, a shorter form, a new onboarding step, an automated follow-up, or a decision to stop sending the wrong audience into the funnel.
09
Applied to HAAM
A studio website can become a small design-intelligence system.
HAAM already has the beginnings of this architecture: consent-aware analytics, search and performance signals, a defined event taxonomy, project and service routes, contact flows, product experiments, and multiple editorial formats.
The next layer is to give each asset a strategic role. A Systems essay can create relevance. A project page can create proof. A service page can translate proof into an offer. A project starter can make intent explicit. A form can qualify the opportunity. CRM and proposal data can reveal whether the opportunity became valuable work.
Example HAAM funnel
This makes editorial work legible without reducing it to last-click attribution. An essay may never be the final conversion page, yet it may repeatedly introduce the idea that makes a later service credible. BI can preserve that assisted role and help HAAM decide which systems deserve deeper research, which projects need better evidence, and which offers are attracting the right work.
10
The boundary
Do not optimize the meaning out of the experience.
A measurable action is not automatically a good action. Design intelligence should help the organisation learn, not turn every surface into pressure.
Dark patterns can improve a local metric. Aggressive prompts can increase starts. Forced registration can create accounts. Misleading scarcity can accelerate purchase. None of these prove that the system created durable value. They may simply move harm beyond the dashboard's field of view.
The mature question is not only, “Did conversion increase?” It is also, “For whom, through what mechanism, at what cost, with what downstream outcome, and would we still defend this design if the user understood the measurement system behind it?”
The goal is not a business that watches every user. It is a business that can learn from its own decisions.
Technical references
- Microsoft: What is Power BI?, Connecting, preparing, modeling, visualizing, and sharing organisational data.
- Google Tag Manager: The data layer, Passing organized events and variables from digital experiences into measurement tools.
- Google Analytics: Funnel exploration, Defining ordered steps, open and closed funnels, breakdowns, elapsed time, and next actions.
- Google Analytics: Recommended events, A reference for consistent event naming across common user and commerce actions.
- dbt Developer Hub: What is dbt?, Transforming raw warehouse data into tested, documented, reusable analytical models.
Continue through HAAM
- Interaction Design, shaping usable systems and the evidence they produce.
- AI and Automation, connecting operational flows, tools, and decisions.
- HAAM Signal Agent, turning public digital evidence into reviewable opportunity signals.
- How HAAM Works, from context and system design through implementation and iteration.